
I once read an article that was quite unique. It said that people who take a break during the day have a higher potential for cancer than people who continue their work. Is it true that people who take a lunch break at work have a higher potential for cancer? Why should it be those who take a break during the day who get cancer attacks. Aren’t those who continue their work potentially more stressed than those who take a break. Is it true that the increase in cancer is influenced by resting during the day? Is it true that an increase in certain factors is influenced by certain things?
Regression analysis
Now I want to teach you a bit about regression analysis. I ask you to imagine yourself as a sales manager in a company that focuses on selling coffee-based products. As we all know, there are many variables that affect the sales of a product. For example, weather, simplicity of distribution, effectiveness of discount programs, advertising, selection of partners for cooperation, brand positioning compared to competitors, market penetration ability of a product and of course there are many more if mentioned one by one. We may say that during the rainy season our product will sell well, and boom! after the rainy season the product does not face an increase in sales.
Regression analysis is a mathematical way to separate which variables have the greatest impact on other variables. With regression, we can answer, what are the influencing factors? What factors can we ignore? And most importantly, what should we do with all these factors?
In regression analysis, two types of variables are analyzed, namely the dependent variable and the independent variable. We can separate one variable that we want to predict, for example, such as monthly sales, as the dependent variable, and other variables that we suspect affect the level of sales are the independent variables.
How regression analysis works
To be able to use regression analysis you don’t need to do it yourself, you can ask your colleague who is a data analyst or you can ask a freelance data scientisit to help you. The first thing you need to do is to take the data you have, for example, sales data for a few years ago, which acts as a control variable. Add a variable that acts as an independent variable; the added independent variable is a factor that catches your attention, that you think is the cause of the decrease or increase in the product you sell, for example, the rainfall rate. If you want, you can see the sample code I uploaded on GitHub
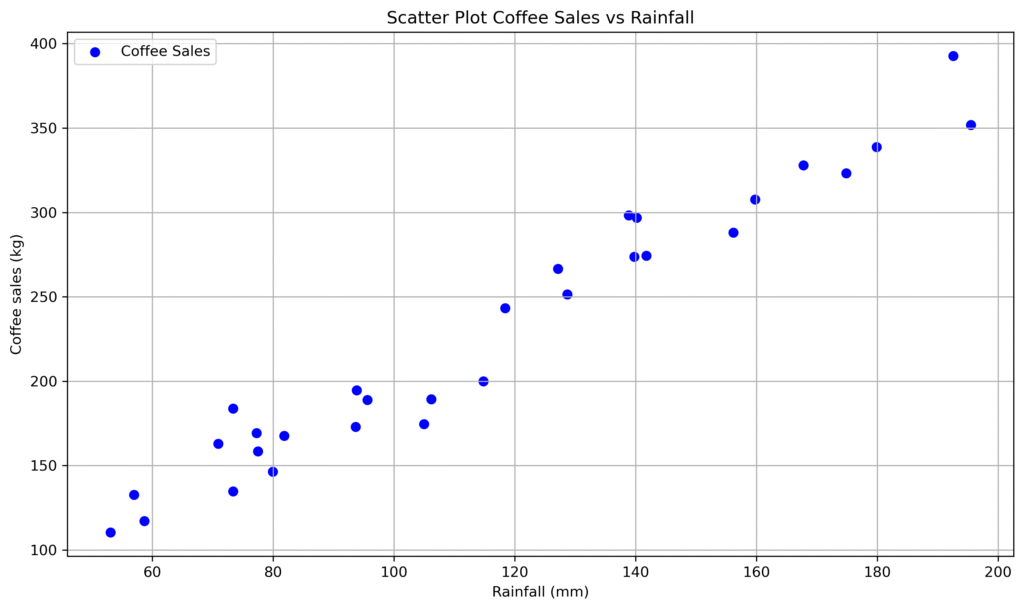
The y-axis shows the number of coffee products sold in kilograms (kg), while the x-axis shows rainfall in millimeters (mm). Each point represents the sales results for 2 weeks. You can see how the rainfall and sales amounts for 2 weeks are based on the graph above.
As you can see, you can easily see that when rainfall increases, coffee sales increase. The interesting thing part is, how much coffee is sold if the rainfall conditions show a certain value? What if the rainfall increases by 2mm? What will be the increase in coffee sales?
Regression line
When I was in high school, i studied linear equations, but I didn’t know the function of linear equations and my teacher couldn’t explain its function in daily life. Now is the right time to use linear equations to help us predict our coffee sales.
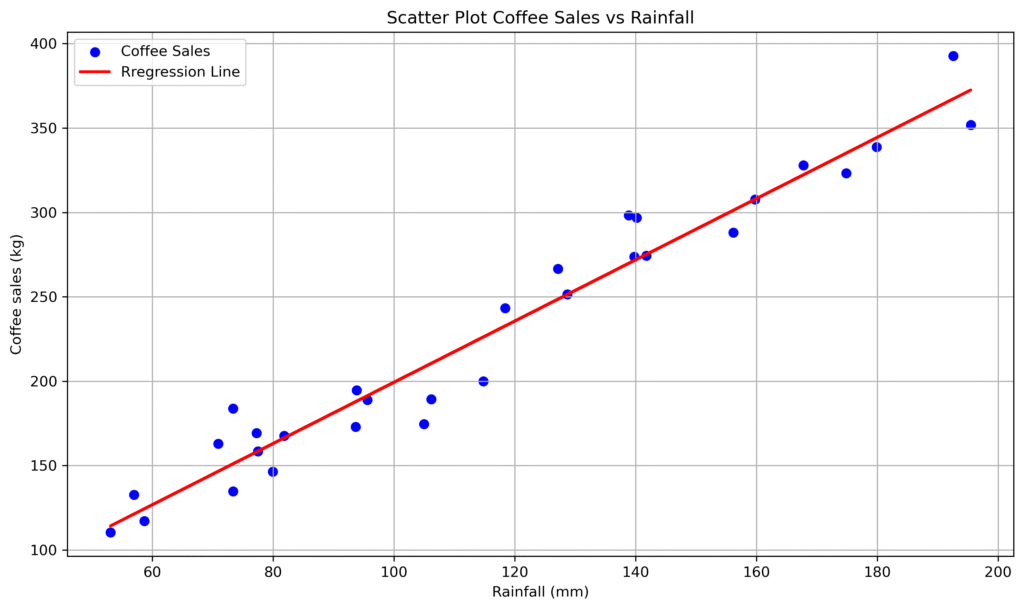
This red line is a regression line, you can create it using statistical programs such as Excel, SPSS, Tableau and many more, but on this occasion I used Python to visualize it. Regression lines are the easiest way to find out how the relationship between variables. Note that there are three types of regression lines: positive, negative, and not related at all.
The generated regression line has a linear equation that you can see in your statistics program. The line above has the equation.
Coffee sales = 17.87 + 1.81*(rainfall) + error
The linear equation for the regression line is as above. And we can ignore the error, the error variable is added because the regression equation cannot have 100% accuracy, just focus on the existing equation.
Coffee sales = 17.87 + 1.81*(rainfall)
With this equation, we can find out if there is no rain in 2 weeks, the average coffee sold is 17.87 kg. Likewise, with an increase in the amount of rain, we can predict coffee sales if the increase in rain intensity is 70mm, the average coffee sales are predicted to be 144.57 kg. Thus, it can be concluded that with an increase in rainfall of 1 mm, the increase in coffee sales increases by 1.81 kg.
Multivariate regression
Regression analysis is also called mutivariate regression analysis when the variable being analyzed is more than one. I will add another variable, for example, the cost of advertising. After entering it, the equation below is obtained. It is found that the influence of advertising is not greater than that of rainfall.
Coffee sales = 17.87 + 1.81*(rainfall) + 0.9*(advertising cost)
Back to the error variable, the error variable is important in regression analysis because it is impossible to produce a completely accurate equation. Regression only provides an average at each point, not an exact result. The smaller the error variable, the more reliable the results of regression analysis.
The example above is just an example of several variables, that is, the relationship between rainfall and coffee sales, and advertising. In general, we have a hypothesis about which variables affect the sales of our products. It could be that the simplicity of distribution has a big effect on product sales, it could be that the market we are penetrating is already saturated with our derivative products, we can include many variables in regression analysis to produce a smaller error value. With regression, we can find out which variables have a strong influence on our sales.
How do companies use regression?
Companies that have been established for a long time usually have a complete database. A good company uses this data as a foothold to make the next policy. For example, HRD can recruit the best people who are needed by the company. The marketing manager can answer the question of what factors affect product sales.
Companies can also use regression to predict future sales, for example, if the advertising costs spent are increased, the sales will increase by a percentage. With this prediction, the production department can prepare products according to predictions.
Another thing to remember is that “correlation is not causation“. In the book The Naked Statistics, Charles Wheelan. Wheelan reminds us that just because a variable is correlated does not mean it is the cause. Going back to coffee sales, we can say that as rain intensity increases, coffee sales will increase. But whether the cause of the increase in coffee sales is the increase in rain intensity is a different matter. Unless you sell raincoats.
Actually, there are many regression topics that can be explored, but I think this article is enough to outline how regression works. In the future, I will discuss how if the data being analyzed is small, can we use regression analysis?
Also read: How Statistics ‘Play it Safe’ Why Do Surveys Have a Margin of Error?