
Have you ever heard of margin of error? usually margin of error is found in inferential statistics products (one of the branches of statistics that serves to draw conclusions on a group), for example, quick counts, national socio-economic surveys (SUSENAS), and public opinion surveys. Why should there be a margin of error? How to calculate the margin of error? And how important is the margin of error in a research?
One of the products of inferential statistics is the electability survey. On this occasion, I will take the example of the DKI elections. In 2024, one of the pairs of DKI Jakarta elections, the Pramono-Rano pair, occupied the top position. This survey was taken by the LSI institution, and the Pramono-Rano pair won with 41.6%. (margin of error ± 2.9%)
When reading the results of this survey there may be some of you reading asking, where did the 41.6% figure come from? I’m pretty sure most of my web readers didn’t get a question from LSI about which gubernatorial candidate to support. If we are not asked this question, is this survey really representative? Then why should there be a margin of error in the survey results? Is LSI not sure about their product?
Sample: tasting a spoonful of soup, instead of drinking the whole pot.
To understand how inferential statistics work in this case, electability surveys. Imagine you are cooking soup for your family when the soup is about to be cooked, you check whether the taste is to your taste or not. You only need to taste a spoonful of soup to be able to generally judge the taste of the soup you cooked, whether it is too salty or lacking in spice. You can judge the flavor of a pot by tasting just one spoonful.
Statistics work the same way, rather than asking all of Jakarta’s 10.68 million residents. We simply take a representative random sample. Usually, surveys take samples of 1000 to 1500. As long as the sample taken is correct, the survey results can already be used to find out the tendency of the people of Jakarta as a whole.
Understanding the margin of error
When reading the results of the electability survey where Pramono-Rano is ahead with 41.6%. Some people think that there are 41.6% of Jakartans who support this couple to lead their region. But it must be remembered that this conclusion is obtained from a sampling, which means that it will not be possible to produce an exact number. And if the survey process is carried out again, it is almost certain that the resulting figures will be different. This is a natural thing to happen. Our society is very heterogeneous, there are those who are fanatical about certain couples, if the sample is taken in one of the areas supporting the couple, of course the final results will change
Sample variables are unavoidable. Charles Wheelan said that if something is done repeatedly using the same method, the results may vary even slightly.
How to calculate the margin of error
The margin of error is influenced by three things: the number of samples taken, the confidence level, and the distribution of answers. In general, the margin of error formula can be written as the formula below.
In today’s opportunity. We will use an example of calculating the margin of error of the Pramono-Rano electability survey pair with the following details. The survey value is 41.6%, the sample size taken is 1100 samples, and the confidence level is 1.96 for 95%.
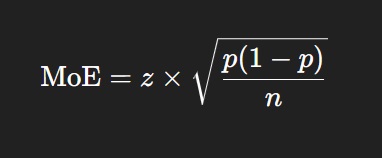
- MoE = margin error
- z = z score (based on confidence level, e.g. 1.96 for 95%)
- p = proportion of the result (e.g. 0.416 if 41.6% supporters)
- n = sample size
import math
from scipy.stats import norm

# Input data
p = 0.416          # proportion of survey results
n = 1100          # sample size
confidence = 0.95 # trust level

# Z-score for confidence level
z = norm.ppf(1 - (1 - confidence) / 2)

# Margin of error
moe = z * math.sqrt((p * (1 - p)) / n)

# result
print(f"Margin of Error: ±{moe:.4f} or ±{moe*100:.2f}%")
On this occasion, I did the calculation using Python, of course, you can do the calculation using other methods. After I calculated it using Python, the results showed that the margin of error obtained was 2.91%.
Summary
By taking a random sample with a sufficient quantity. Researchers can know the general picture of opinions in society on a problem. With the margin of error, researchers can find out how varied the resulting research results are and with the margin of error we can know more about how confident researchers are with the results of their research.
Also read: Central Limit Theorem (CLT)