
Have you ever asked what other people think about your brand? It won’t be easy if we don’t know what people think about our brand. We don’t know whether our brand has a positive or negative meaning, we will find it difficult to develop our brand if we don’t know the community’s sentiment towards our brand.
Sentiment analysis is the process of identifying, extracting, and scoring opinions or emotions in text. With the help of machine learning and natural language processing (NLP) techniques, we can analyze text from various sources, such as customer reviews, social media, or surveys, to understand the positive, negative, or neutral sentiments contained therein.
Sentiment analyst on Twitter
In this opportunity, I will explain about sentiment analyst from a data set of tweets on Twitter, what sentiments appear most, and also I will create a predictive model that can predict a sentence whether it has a positive, neutral, or negative sentiment.
The data I use is a collection of tweet data that can be accessed through the following dataset. In the dataset, there are various kinds of tweets collected and have been grouped into groups.
Exploratory Data Analysis
To create a sentiment analyst, we carry out Exploratory Data Analysis (EDA) to understand the structure and characteristics of the data, as well as to find patterns that the data may contain. The main purpose of EDA is to help us intuitively understand the data, enabling us to make initial assumptions, determine further analysis steps, and uncover insights hidden in the data/

Based on the distribution of the type of label calculated by the number of words, positive data has a greater quantity than others

Both graphs above show that positively labelled data has the highest average words and total characters, followed by negatively labelled data, and finally by neutral labelled data.

The total characters histogram graph shows that the average total number of characters is 180.58, or approximately 181 characters. Additionally, it shows that more than 2000 data points have an average of 100-150 characters.
The total words histogram graph shows that the average total number of words is 29.08, or approximately 29 words. Furthermore, it shows that more than 2000 data points have a total of 20 words.
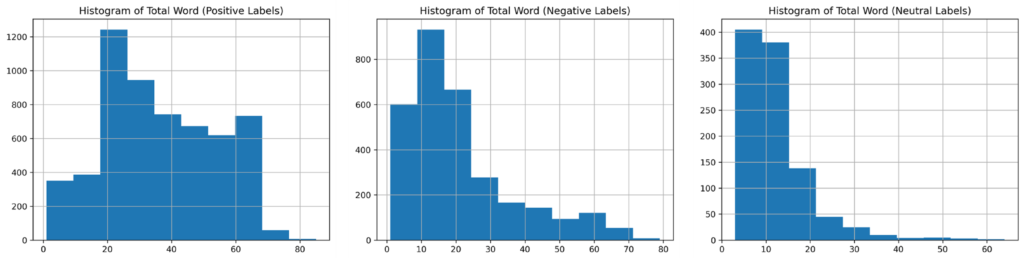
The graph above shows that positive labels dominate with data containing a total of 20 words, totaling 1200 data points. Negative labels dominate with data containing 10-15 words, totaling 800-900 data points. Neutral labels dominate with data containing 1-10 words, totaling 400 data points.
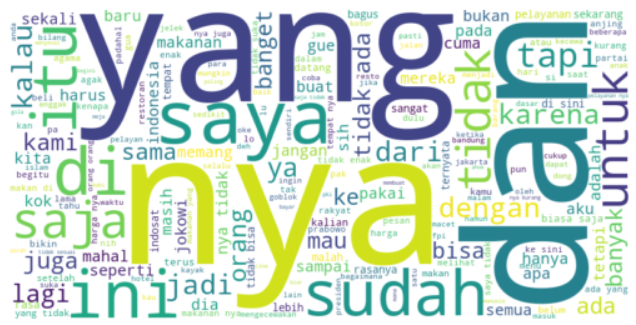
The word cloud animation above shows that the most used word is ‘nya’ with 12,128 occurrences, followed by the word ‘yang’ with 8,332 occurrences. Additionally, the word cloud displays the top-10 most frequently mentioned words in the dataset used.
Machine Learning modelling flow

To create a machine learning sentiment analyst, one starts by inputting the dataset, then cleans the data, trains the model, and evaluates it. After identifying the most optimal model, they store it and proceed to create an API (Application Programming Interface)

Machine learning divides the API into two endpoints: input in the form of JSON and file uploads.The system will process using the machine learning model to find the label. After processing, the system will enter the text and label into the database, enabling it to distinguish all tweets as positive, negative, or neutral. For full coding, you can access it on Git Hub.
Thats it. It’s wrapped thank you for reading..
If you enjoyed this post on Sentiment analysis and interpreting data through data viewpoints, feel free to get in touch with me (Febrian Nur Alam) regarding any thoughts or queries!
Read more. Covid-19 Data Visualisation