
On this project, I had the opportunity to collaborate with my colleague Lilis Lisnawati. She gave me very interesting insights considering that the topic and her background are indeed related.
Many Americans say that reducing crime should be a top priority for the president and Congress to address this year. Around six in ten U.S. adults (58%) hold that view today, up from 47% at the beginning of Joe Biden’s presidency in 2021.
To describe the crime rate in LA, we needed data that reflects the crime conditions in the city. We used data from the Los Angeles Police Department (LAPD)We grouped the various types of crimes in the data into nine categories based on the Uniform Crime Reporting (UCR) program. We collected the dataset from 2020 to the present, but we will focus our discussion on 2022–2023. In the first stage, we will identify crime trends using EDA methodology, and in the next stage, we will forecast crime using machine learning methodology to predict crime at a certain time and area.
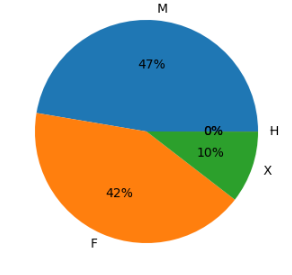
Sex Most Affected by Crimes
Data collected from 2020 to date has shown a trend that crime victims in LA are male with 47%, followed by female with 42%, and finally gender x with 10%. This is quite surprising because it is not what many people think that the victims of crime are women. But overall the ratio of male and female victims is quite balanced at 47%: 42%
Age Distribution of Crime Victims
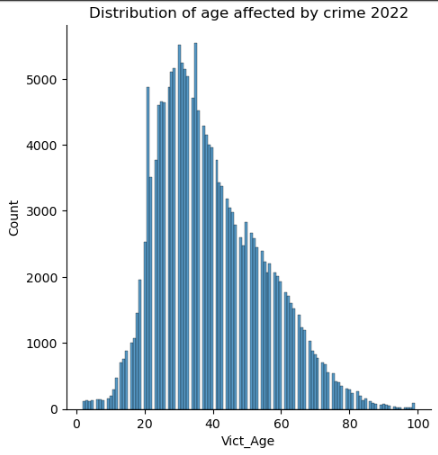
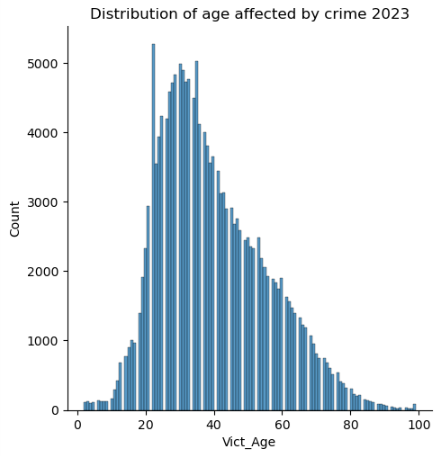
The distribution of crime victims is spread across various ages from children to the elderly. However, the most frequent victims of crime in LA are between the ages of 19 and 30.
Distribution of Criminality Based on Time Occurrence
In this section, we divided the 24-hour day into four parts to facilitate the time analysis process: 00:00–05:59, 06:00–11:59, 12:00–17:59, and 18:00–23:59..


Distribution of Criminality in LA
We grouped the crime data into 8 categories based on the Uniform Crime Reporting (UCR) program to simplify identification. However, because LA had a large number of crimes, we placed crimes that did not fall under the UCR classification into the ‘other’ category. After clustering, we obtained the following results.
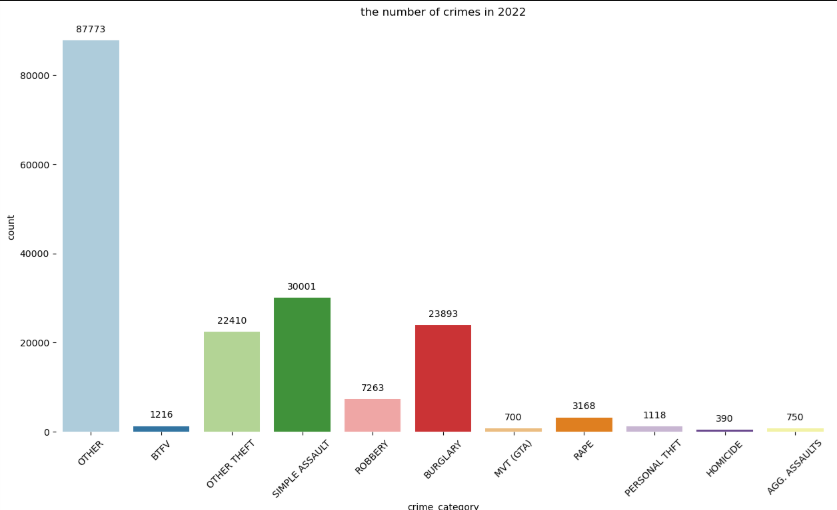
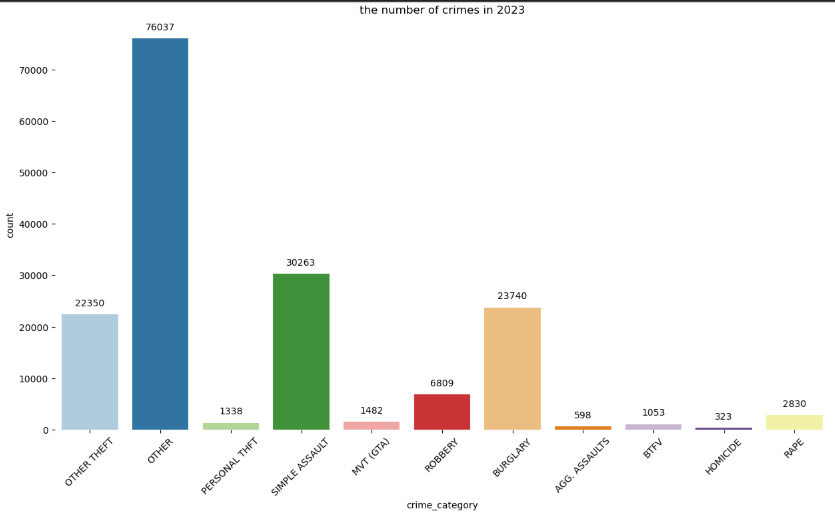
In conducting the analysis we ignored the “other” category because the other category contains a mixed type of crime, there are around 50 types of crimes that are not included in the Uniform Crime Reporting (UCR) programme. So it is not representative if we include it in the analysis process.
In 2022 the top 3 crimes were simple assault, bulgary, and other theft, while in 2023 the top 3 crimes were simple assault, bulgary, and other theft. The same three crime categories dominated the top three crimes that year
Crime Distribution in LA and Surrounds
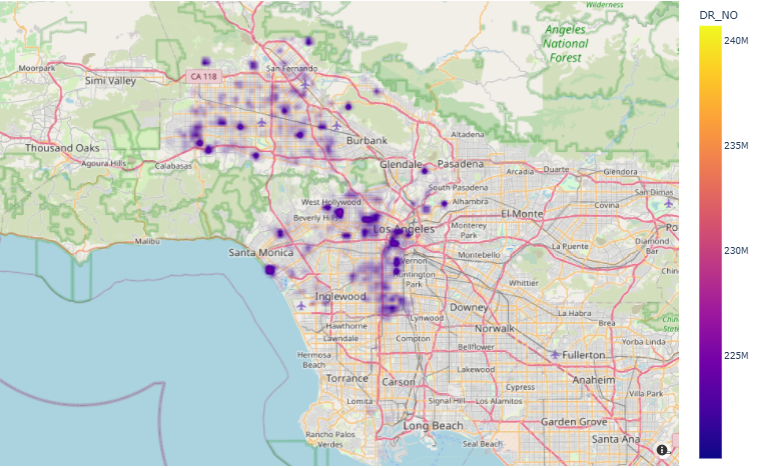
In 2022 police in LA are working harder because crime in that year is widespread in several areas and the epicentre of crime is in LA, which is the centre of the city The more people there are the greater the potential for crime when compared to cities with fewer crowds..
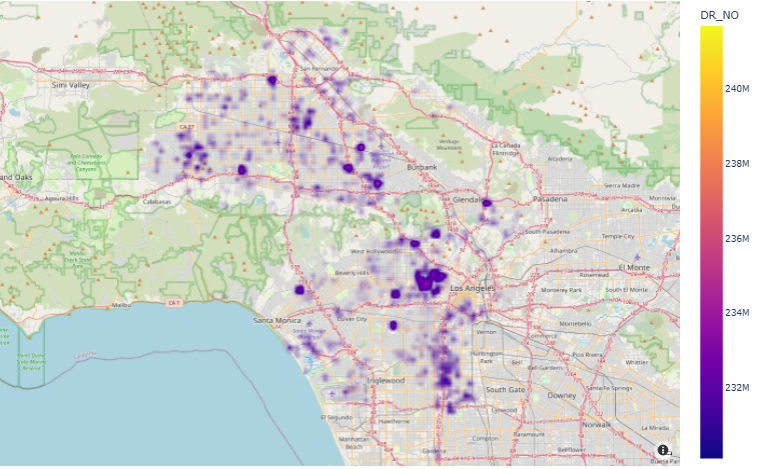
In 2023, criminals concentrate their activities in LA, the city centre, and also commit many crimes in nearby areas like South Gate and Burbank. The police this year are working more on crime cases in the LA area because LA is the epicentre of crime this year.
If you want to see the coding I’ve been working on you can check it out on github.