
Have you ever seen the movie Harry Potter? This movie was very interesting when I was a kid. Harry Potter could do anything just by saying spells and swinging his magic wand. One of the spells that is quite practical is Lumos. Harry can emit light at the end of his wand. Practical, right? But did you know that in data science, there is also a methodology that works like magic? It can turn data with any distribution into a population with the same distribution. Looks like magic, doesn’t it?
The central limit theorem (CLT) method works like magic. It can transform data with any distribution into data with a near-normal average distribution. On this occasion. I will explain the central limit theorem, examples of application, and also examples of CLT application in various fields.
Definition of central limit theorem
Central limit theorem (CLT). It is a statistical method whose basic idea is that if we take the average of a population and do it many times, the average will form a normal distribution even though the population does not have a normal distribution of data. And the data can have positive or negative skewness.
Terms
If we want to use the central limit theorem, there are several things that must be considered so that this method can work well.
Minimum number of samples: The minimum number of samples used in finding averages is 30. However, if the population sample being analyzed has many outliers, then the sample data taken can be increased to 50, 60, 70, or maybe more. Basically, the minimum sample taken is 30, and the more samples the better.
The sample taken is random: Sampling must be done randomly and also perfectly distributed. This means that in every part of the population, we take data to be sampled. If we do not do this, then the results obtained will not be maximized.
Has limited variation: Limited variation here means that a population has data that has certain limits, so it can still be counted. An example of a distribution that cannot use CLT is the cauchy distribution.
Coding example of CLT application
The central limit theorem can basically be used in various types of population distributions, but for now the example that will be used is a population with positive skewness or more skewed to the left.
#First step to import all required packages
import numpy as np #processing data
import seaborn as sns #data visualization
import matplotlib.pyplot as plt #display graphics
from scipy.stats import skewnorm #generate dummy data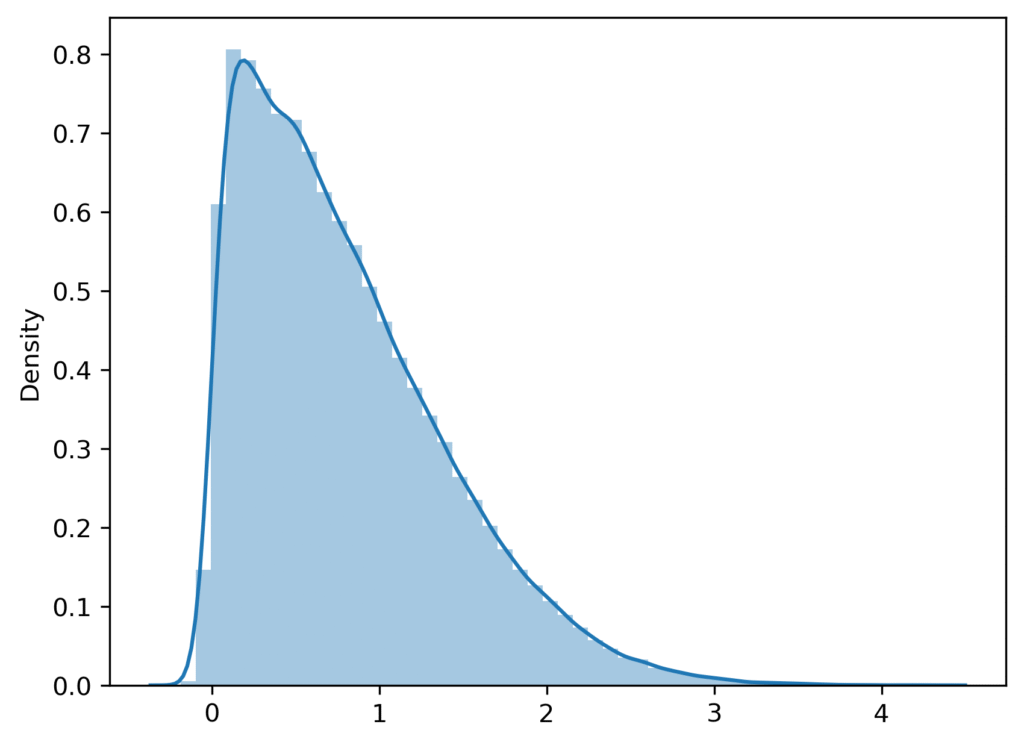
#Then generate population samples that have skewness
s = skewnorm.rvs(20, size=100000) #generate population
sns.kdeplot(s) #visualizing using seaborn
#Applying CLT to the population of interest
def applyCLT(population_array, sample_size, n_samples):
sample_means = []
for i in range(n_samples):
sample = np.random.choice(population_array, size=sample_size, replace=False)
sample_mean = np.mean(sample)
sample_means.append(sample_mean)
return sample_means
#Applying CLT to the population
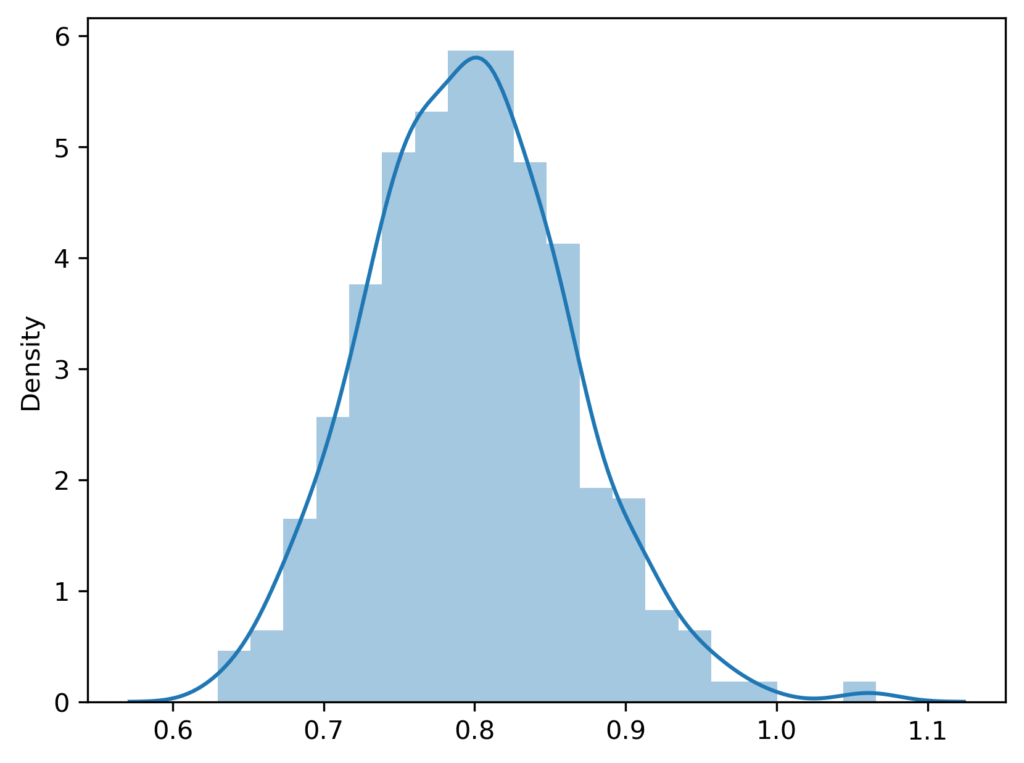
m = sns.kdeplot(applyCLT(s, 80, 500)) #the average sampling size was 80, and was performed 500 times.
As can be seen, even a population with 100,000 data and a very skewed skewness. After applying CLT to 80 samples and repeating the process 500 times, a near-normal graph of the population mean is obtained.
Implementation central limit theorem
The central limit theorem can be used in the field of statistics and data science when we are required to use a population data with a normal distribution. such as t-tests, ANOVA, and regression. In addition, this method can be used for various fields, for example, in the pharmaceutical field, researchers will see whether the drugs produced are successful or not. In addition, it can also be applied to the fertilizer industry. With this method, even though the levels of substances contained in the fertilizer released are different. As long as the resulting average distribution is good enough, the product can be declared fit for distribution.
The basic idea of this method is that by using a relatively small sample, we can find out the overall condition of the population. Of course, you can use it in various fields and problems. How about it? Is this method like magic? haha
Also read: How to lie with statistics