
Edward Simpson was a code-breaker at Bletchley Park, a statistician, and a public servant. Edward was born on December 10th, 1922, to Captain Hugh and Mary Simpson. Edward described the statistical phenomenon that took his name in a technical paper in 1951. The Simpson paradox is one of the most interesting paradoxes in statistics because it does not affect the statistical model. However, it can mislead people who are not statistically trained.
When average is not good enough: The Simpson’s paradox
UC Berkeley’s suspected gender bias case became one famous example. In the early 1970s, applicants sued the University of California, Berkeley for gender discrimination in graduate school admissions. Of the 8,442 men who applied for the fall of 1973, the university admitted 44 percent, while it accepted only 35 percent of the 4,351 women who applied. At first blush, and assuming the applicants qualifications were similar, this pattern indeed appeared consistent with gender discrimination.
The Simpson Pradox:
A trend or result that is present when data is put into groups that reverses or disappears when the data is combined.
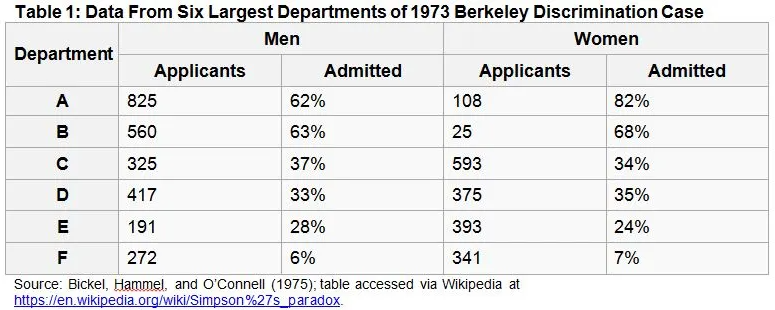
The table above shows the number of applicants in each department grouped by gender, on the left is a group of applicants with male gender and on the left group is an applicant with female gender.The table above also shows the number of applicants and the percentage of students accepted.
Generally, the average number of women admitted to each department is higher than the number of male admitted. This may be because females who apply tend to apply to departments with less student capacity.
Simpson’s paradox can make decision-making hard. We can scrutinize, regroup, and resample our data as much as we want, but when different categorizations lead to multiple conclusions, selecting the right grouping to draw insights and develop strategies becomes a nuanced and difficult challenge. We need to know what we are looking for and to choose the best data-viewpoint giving a fair representation of the truth. Let’s think about a simple example in business.
As our society grows more diverse, Simpson’s paradox may make more frequent appearances. Scholars and policy-makers will have to be mindful as they examine long-term changes in social and economic progress. We would overlook real progress in these areas if we naively relied on single averages.
Yeay it’s wrapped… Thank you for reading
If you enjoyed this post on Simpson’s paradox and interpreting data through data viewpoints, feel free to get in touch with me (Febrian Nur Alam) regarding any thoughts or queries!
Also Read: How to Visualizing Data 101