
“Garbage in, garbage out” may be a term rarely heard by common people. This term is very popular in data science circles. The basic idea of “garbage in, garbage out” is that if data is put into an algorithm, the resulting information will also be poor. And yes, if you are just looking for the definition of “garbage in, garbage out” then this is it. But if you want to learn more about the history, definition, and how to handle “garbage in garbage out” problems, you can read this article further.
History
Who originated GIGO is still unclear, but the most famous opinion is that this term comes from an English mathematician and engineer named Charles Babbage. in 1820, Babbage invented a computing device which he called the Difference Engine. In simple terms, this tool is a mechanized calculating device. One day, someone asked him whether his invention could produce the correct result if given the wrong input. The question surprised him—he was shocked because he hadn’t considered that people might believe such a thing was possible.
Then in 1862 George Fuechsel, according to (Stenson, 2016). George was a programmer from IBM. He claimed that if we put bad information into our computer model, we will get bad information from it. Expect controversy, bad insights, bad decisions, and bad policies to follow.
What is garbage?
If GI produces GO, if the data entered is bad, it produces bad information. Then what is garbage? The answer is simple: Bad data There are several examples of garbage/bad data.
- Duplicate data
- Missing data
- Ambiguous data
- Inaccurate data
Over time, of course, there will be some additional terms for garbage. But the basic idea is very clear, where. Bad data recorded and retrieved by someone, if processed with any algorithm, will result in misrepresentation.
How to handle it?
GIGO’s solution is the Cross-Industry Standard Process for Data Mining. CRISP-DM was developed in 1990 by an international consortium and simplified by Chapman et al. in 1999. The overview of CRISP-DM is as follows
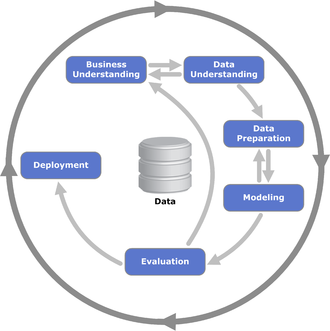
CRISP-DM uses a scientific approach to maintain data quality. The first step involves understanding the business, which helps identify the client’s needs and the questions that can be answered through analytical processes.
By using this well-established method, we can minimize garbage. If garbage data enters a process, it disrupts other processes. To prevent this, we must actively avoid the entry of garbage into the system. CRISP-DM consists of several stages, which are explained below:
Business Understanding
This is the first stage in the process. This stage requires knowledge of the business being run, how the data will be captured, and how the modeling will be done according to the business objectives.
Data Understanding
This stage is basically checking the state of the data, whether it has potential problems that will arise such as missing values, duplicate data, mislabeling, and identifying which data is optimal for use in the modeling stage. At this stage, you must take care because bad data can affect the modeling process.
Data Preparation
This stage focuses on fixing bad data. The team cleans the data by normalizing it, removing missing values, filling them with the average or median depending on the case, and correcting any incorrect labels.
Modeling
Followed by creating the required model can be in the form of descriptive and predictive models. At this stage, statistical and Machine Learning methods are applied to simplify the modeling process. The methods used include scoring, prediction, relationship discovery, and others.
Evaluation
The team rechecks the results to ensure they align with the initial objectives. If the results seem unsatisfactory, they make improvements; otherwise, if the model meets the objectives, they proceed to the deployment stage.
Deployment
At this stage, the developer applies the finished model to the desired product, such as a website or dashboard. The purpose of deployment is to make it easier for everyone to access the finished model. One thing to remember is that no one can use a model continuously. This is because the data will continue to change from time to time. It is necessary to re-evaluate the existing model periodically.
If you enjoyed this post on Sentiment analysis and interpreting data through data viewpoints, feel free to get in touch with me (Febrian Nur Alam) regarding any thoughts or queries!